The user is able use the drawing tools to define spatial regions of interest and obtain tabular and graphed results (statistics) from such specified regions.
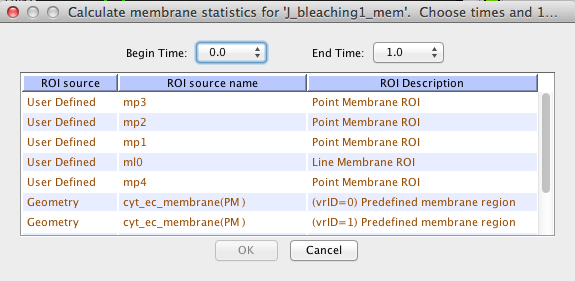
Statistics: the minimum, weighted mean and maximum can be calculated for variables in a Region of Interest (ROI). Volume and Membrane variable statistics are calculated when any given data vari- able is selected in the results viewer variable list and the ?Statistics? button is pressed. A dialog will be displayed with selectors for setting a time range (Begin Time, End Time) and a list of available ROIs. ROI source shows if the ROI has been pre-defined by Geometry or User Defined (e.g. by using the point or spline tools to create the ROI). The ROI Source Name is either taken from the Geometry or generated automatically as the user creates the ROI (e.g. vp1, vp2... for volume points in order of creation). The ROI description provides additional information on the ROI type (e.g. Point Volume, Ar- eas Enclosed Volume).
Snapshot ROI:To plot statistics for an ROI, select the range of times and one or more ROI sources (ctrl-click) that
you wish to examine and press OK.