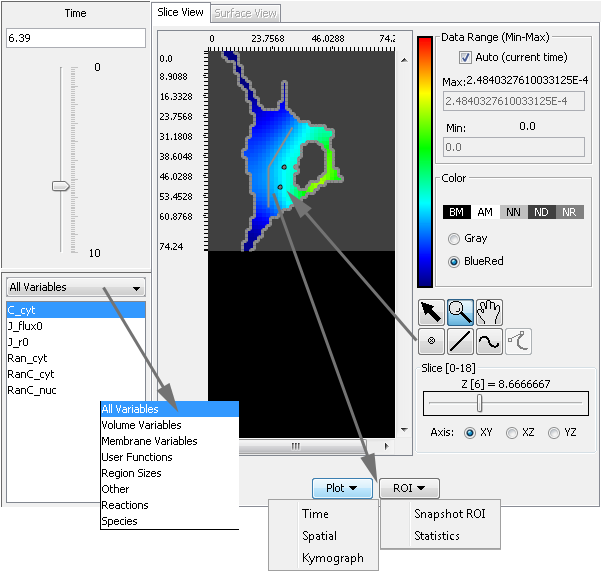
Spatial Simulation Results Slice/Surface View
The main interactive viewer for simulation results.
Slice viewer controls for volume variables allow the user to select a variable, a specific simulation time-point, a slice plane if 3D,
a data range for display color scaling, a color colormap for basic display settings.
Other controls include zoom, pan, region-of-interest(roi) (point, line, simple open and closed polygons), roi plots and statistical summary plots.
Surface viewer controls allow for the manipulation in 3D of surface rendered membrane variables and the definition of regions-of-interest.
Slice View tab tab. Displays volume and membrane data as an orthogonal slice (z,y,z) image.

- Time panel-
Sets a simulation time-point to display in the viewer. Update the currently displayed data by editing the text field, sliding the time pointer or using the up-down arrows on a keyboard.
- Variables button menu- Drop-down variable category selector and variable list.
Category selection changes the variable names displayed in the variable list.
Selection from the variable list sets a variable to display in the viewer.
- Slice panel- Use radio-buttons to select orthogonal plane orientation. Move slider to set depth of visible slice plane within the data.
- Data Range/Color Scale panel- see Data Range/Color Scale
- Tools panel- see Slice View tools
- ROI button menu- Selecting Snapshot ROI will create an ROI from the currently displayed variable that includes all points that equal one (1.0).
Selecting Statistics will show a dialog listing a set of predefined ROIs (including any snapshot ROI) and controls
to generate some simple statistics.
- Plot button menu- see Plot
Surface View tab.
