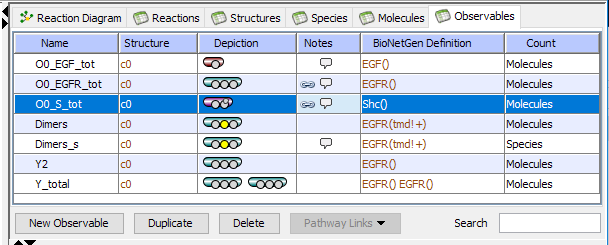
Observables Table
Observables are used to specify the outputs of a model; they are functions of the
total population of multiple species that share a set of properties. For example, to
simulate the tyrosine phosphorylation level of a particular protein, the
Observable would be a function describing the total amount of all species containing
the phosphorylated form of the protein.
- Each Observable consists of one or more Species Patterns. Each observable selects species that match at least one of the species patterns (not both).
- A species pattern defines common features of multiple species, and consists of one
or more of the molecules that compose a species. Molecules may or may not be explicitely connected, but must be present in every species selected by the species pattern. Sites that have multiple possible states are depicted with a small yellow ball above the site.
- Each molecule within a species pattern may have sites left undefined. If a site does not have defined states (where states are possible) and the site can be in the bound or unbound state, the site is colored white.
- An observable may identify sites with a defined binding state - i.e. the function can explicitly identify a site bound to another site, a site unbound, or a site bound to an unspecified (i.e. any other) site; in this case the site is colored green with a bond drawn as a colored line if one exists.
- A site that has a defined state is always shown in green.

The Observables Table displays
- The Name of Observable (can be edited).
- The Structure indicates where the species selected by an Observable are located .
- The Depiction of each Observable. Green circles within each molecular shape denote
molecular sites, small yellow circles denote that this site has possible states.
- Notes show a link icon if there are annotated links to database entries or a text bubble if there are text annotations for the reaction. Double click in the Notes column to show the Annotations Properties Pane for a reaction.
- A
BioNetGen definition. The definition cannot be edited but can be searched.
- The Count of either Molecules or Species. The count of molecules is a weighted sum of the population levels of all the species that match the pattern(s) defined in the observable. Each amount is multiplied by the number of times that the species is matched by the pattern(s). For example, a species that consists of two instances of a receptor (i.e. a dimer) is counted twice.
The count of species is an unweighted sum of
the amounts the species that match the pattern(s) define by the observable.
For example, a species that has two instances of a receptor is counted once.
Edit an Observable name within the table. Note that the function defined by the observable and its properties must be specified in the Observables Properties Pane.
Filter the list of observables using the Search Box to enter a name or any part of the observable composition.
Delete an observable by selecting and using the "Delete" button below the table.
Add or Edit Annotations using the Annotations tab in the Properties Pane.

