The Plot->Spatial menu-button item is enabled once you use the line or spline tools to define a region.
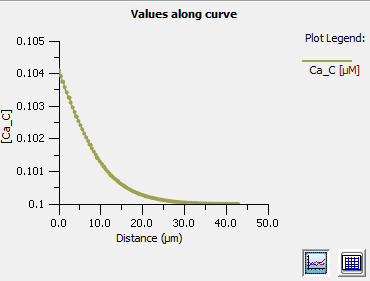
Select the created line or spline, select Plot->Spatial to display a plot of the data along the line or spline.
The graph is interactive; as you move the mouse over the graph, the coordinates are displayed in the bottom left corner.

Select from plot or table of values display by selecting icons located in the lower right area of the dialog.
The Plot->Time menu-button item is enabled once you use the point tool to define a point or series of points.
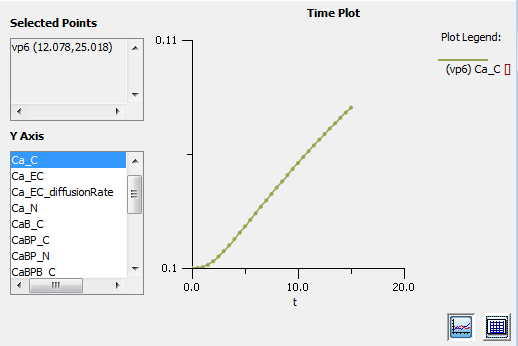
Select Plot->Time to view a line graph of currently selected simulation data variable at each timepoint over time.
Point coordinates are listed in the top left corner of the Time Plot frame.
Use the 'Y Axis' list to select 1 or more variables to plot.

Select from plot or table of values display by selecting icons located in the lower right area of the dialog.
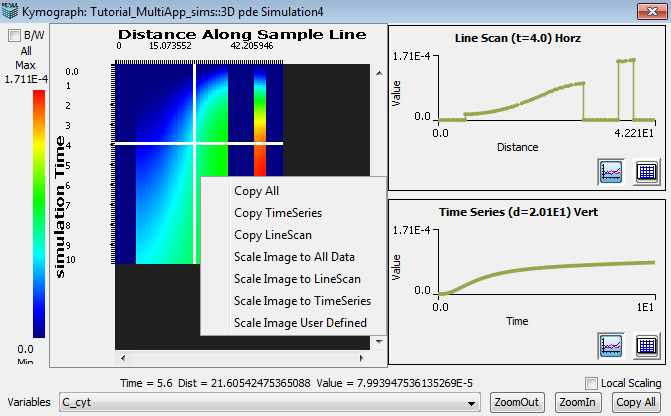
The Plot->Kymograph menu-button item is enabled once you use the line or spline tools to define a region. The kymograph displays line scans over time as 2D image with the X axis representing distance along the ROI line and the Y axis representing time. Two graphs display the simulation data values of the kymograph with the top graph displaying the horizontal crosshair values (values along the ROI at 1 time point) and the bottom graph displaying the vertical crosshair data values (values along time at 1 ROI point). These plots will update according to the position of the crosshair in the image data panel which can be moved by clicking the mouse or using the arrow keys.
