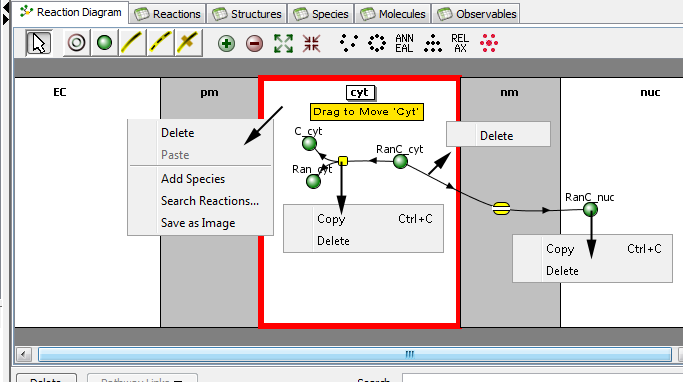
The reactions diagram shows a bipartite graph consisting of species (green balls for species that do not have molecular details, or blue balls for species with molecular details) and reaction (yellow squares) nodes, each within the appropriate compartments, and with lines connecting the species that participate in a reaction. In rule-based models, species patterns representing reactants and products defined within rules are depicted with ovals around balls (molecules) of various colors.

Structures are depicted as connected rectangles within the workspace. Species are green or blue balls and reactions are yellow squares placed into the structures. Lines each connect one species with one reaction: solid lines with arrows denote reactants and products with the arrow indicating the direction of the forward reaction; dashed lines denote catalysts. Stoichiometric coefficients, if different from one, are displayed next to the appropriate lines. Toolbars above and below the diagram provide tools to edit the diagram.
When a single object in the graph is selected, properties of that object are displayed in the Properties Pane in the bottom right pane of the window. Details of reactions and fluxes can be edited in this pane, as described in the reaction and the membrane flux Properties Pane Help.
The toolbar above the graph provides tools for creating and editing species, reactions, and fluxes; selecting the tool alters the function of the mouse as described below.
![]() The Selection tool selects Species (graph nodes), connecting lines (edges) or reactions by mouse click, or drag the mouse to select multiple components. Add elements to the selection using the shift key with the left mouse button, toggle the selection using the control key.
The Selection tool selects Species (graph nodes), connecting lines (edges) or reactions by mouse click, or drag the mouse to select multiple components. Add elements to the selection using the shift key with the left mouse button, toggle the selection using the control key.
![]() The Structure tool inserts a new structure by clicking between existing structures or appending new structures to the ends.
Dashed vertical lines appear on the reaction diagram to indicate where structures can be added. Hovering with the mouse turns the dashed lines green with instructions to 'click to insert structure' a new structure between the dashed lines. When clicked a menu appears to 'Add Compartment to add a volume compartment or 'Add Membrane" to add a membrane compartment.
The Structure tool inserts a new structure by clicking between existing structures or appending new structures to the ends.
Dashed vertical lines appear on the reaction diagram to indicate where structures can be added. Hovering with the mouse turns the dashed lines green with instructions to 'click to insert structure' a new structure between the dashed lines. When clicked a menu appears to 'Add Compartment to add a volume compartment or 'Add Membrane" to add a membrane compartment.
Move a structure using the 'Selection tool'. Click and drag on the structure name to enable drag to move; releasing the mouse over any set of vertical dashed lines moves the structure and contents to the new location.
Create a destruction reaction by dragging from an existing species to open space. Make a creation reaction, by dragging from open space to an existing species. Create an intermediary species by dragging from reaction to reaction (or open space).
If a reaction is drawn from species in one volume compartment to a different volume compartment, the reaction is placed in the membrane. Reactions between species in different volume compartments is allowed in nonspatial applications but act as source or sink reactions in spatial applications and invoke a warning when a spatial application is created.
Enter kinetics for reactions in the Object Properties pane when the reaction is selected, as described in the Reaction Properties Pane Help.
Enter kinetics of fluxes in the Object Properties pane when the Membrane Flux is selected, as described in the membrane flux Properties Pane Help.
The layout buttons automatically arrange the components (graph elements) by different algorithms. These include (from left to right) random, within an ellipse within each structure, so that most lines point downward, to make lines shorter and more similar to each other in lengths, and to place nodes more evenly across each structure.
Buttons to the right of the layout buttons alter the depiction of species and reactions in the diagram and are particularly useful for Rule-based models.The mouse popup menu provides several functions depending on the current selection (structures,reactions,species):
The delete button deletes selected elements. Delete will fail if a species is connected to a reaction or flux; you must first delete the reaction or disconnect the species from the reaction.
The Pathway Links button allows the user to follow links from model elements (species, reactions or fluxes) to pathway elements, or to edit pathway links.
The search text field allows the user to select multiple components that have a similar name.
The bottom pane of the window displays the Object Properties for the selected reaction, membrane flux, species, stoichiometry or structure properties. Enter kinetics for reactions and membrane fluxes in the selected Object Properties.